This is a technical analysis that combines these four technical analyzes. The purpose is to offset the advantages and disadvantages of the oscillator and trend-follow indicators simply by summing them up at the same points.
How to read Binary Wave
The rule is to assign +1 when each of the four technical indicators indicates an “uptrend” and -1 when it indicates a “downtrend”, and simply sums up the total points. If all indicators show a “buy trend”, it will be +4, and if all indicators show a “sell trend”, it will be -4, and the middle figure indicates the strength of the buy / sell trend.
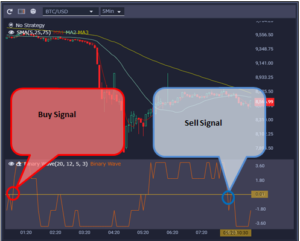
Sirius Future’s Chart
Buy Signal
When the binary wave at the bottom of the chart breaks out of the zero line.
Sell Signal
When the binary wave at the bottom of the chart breaks below the zero line.
Virtual currency system trading ・ automatic trading tool
Sirius Trader(Spot・Futures)
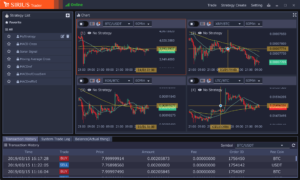
Create strategies within candlestick charts, compare the performance of multiple strategies through back testing, select the most effective and begin trading.
Download Now
AD.

Leave a Reply