
This is an oscillator-based technical analysis method developed by Masaharu Shinohara to scientifically predict and approach based on daily price movements.
The A ratio can be used alone, but it is most commonly analyzed from the correlation with the B ratio.

Sirius Future’s Chart
Buy Signal
① When the B ratio overtakes the A ratio from below to above in a low position (around 100%)
② As A and B ratio plummets from a high position and falls below 70%
③ The A ratio approaches the A ratio from a high position while the A ratio stores energy at a low position.
Sell Signal
① Sell if the ratio falls when the B ratio is over 300%
② Sell when B ratio triples before rising
Virtual currency system trading ・ automatic trading tool
Sirius Trader(Spot・Futures)
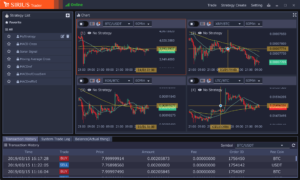
Create strategies within candlestick charts, compare the performance of multiple strategies through back testing, select the most effective and begin trading.
Download Now
AD.


Leave a Reply