
This is an oscillator that uses the volume indicator “Accumulation / Distribution” to determine whether it is oversold or oversold.
Since “Accumulation / Distribution” is used, the trading volume is used for calculating the indicator, and the numerical value is derived from the trading volume and the price difference before and after.
It is best used in combination with other indicators to increase the winning rate.
How to read Chakin’s Oscillato:

Sirius Future’s Chart
Buy Signal
Chakin Oscillator breaks through the center 0
Sell Signal
When the Chakin oscillator breaks out of the center 0
Divergence (*): If the price starts to fall when the Chakin oscillator starts to rise, it will signal a buy signal to indicate an uptrend. Conversely, the sell signal is when the price is rising but the Chakin oscillator is falling. This suggests a downtrend in the future.
* Divergence = the state where “candlestick” and “Chakin Oscillator” are moving in reverse.
Virtual currency system trading ・ automatic trading tool
Sirius Trader(Spot・Futures)
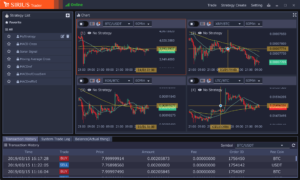
Create strategies within candlestick charts, compare the performance of multiple strategies through back testing, select the most effective and begin trading.
Download Now
AD.


Leave a Reply