
The RMI (Relative Momentum Index) uses the technical indicator’s momentum to determine whether the market is oversold or overbought based on the price range.
Sirius Future’s Chart
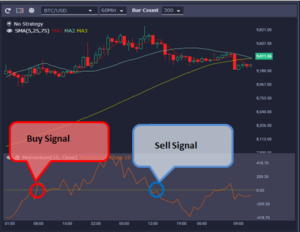
Based on zero, if the negative value is positive, the price is on the rise, and if the positive value is negative, the price is on the downside.
Buy Signal
Smoothness: The point that passed through 30%
Contrarian: a point below 30%
Sell Signal
Smoothness: A point below 70%
Contrarian: Over 70%
Virtual currency system trading ・ automatic trading tool
Sirius Trader(Spot・Futures)
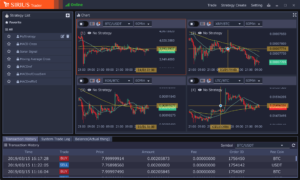
Create strategies within candlestick charts, compare the performance of multiple strategies through back testing, select the most effective and begin trading.
Download Now
AD.


Leave a Reply