
The Ease of Movement Indicator (EOM) is a volume-based oscillator.
It is designed to measure the relationship between price and volume and display that relationship as an oscillator that fluctuates between positive and negative values.
How to read EOM:
EOM fluctuates above and below the zero line. This is done to quantify the “easiness” of price movements. The basic understanding is that the more positive the EOM is in the positive territory, the more easily the price is rising. The more the EOM swings into the negative territory, the cheaper the price will fall relatively easily.

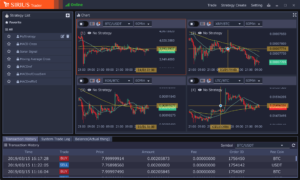
Sirius Future’s Chart
Buy Signal
As it turns from the minus to the plus.
Sell Signal
Changes from a plus to a minus.
Virtual currency system trading ・ automatic trading tool
Sirius Trader(Spot・Futures)
Create strategies within candlestick charts, compare the performance of multiple strategies through back testing, select the most effective and begin trading.
Download Now
AD.


Leave a Reply