
ROC (Rate of Change) is an oscillator-based technical index that identifies trends in overbought and oversold stock prices based on the rate of change between the closing price on the day and the closing price in the past.
ROC charts the price volatility over a period of time in chronological order.
Sirius Futures Chart
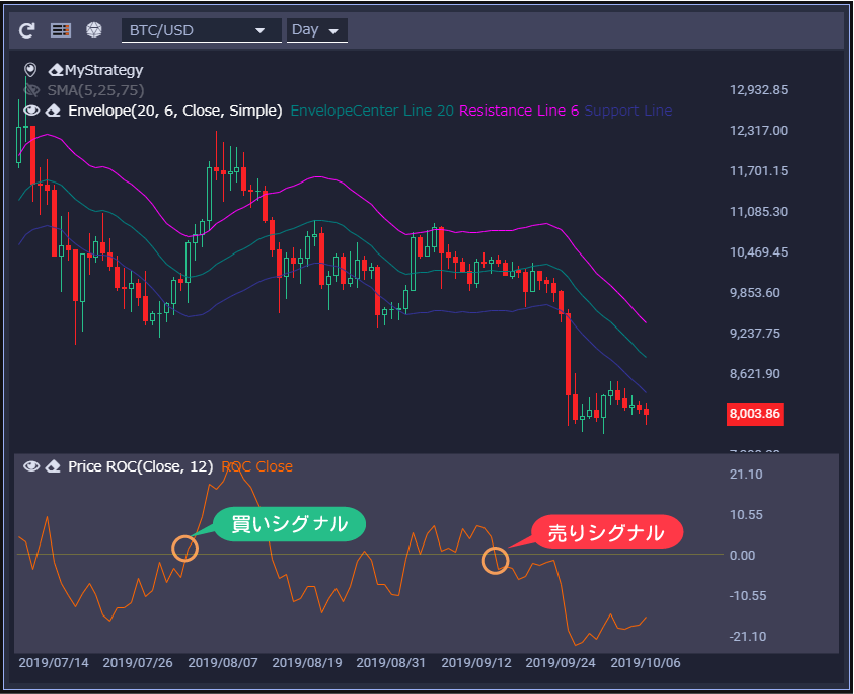
If it exceeds the 0.00 reference line (zero line), the market price is strong, and if it falls below 0.00, the market price is weak.
It can be inferred that when the price is above the center line, buying tends to be strong, and when it is below the center line, selling is strong.
If it extends to a position very far from the center line and the direction of ROC changes, it can be read as the point where the trend has changed, so it will be a contrarian point such as buying when the price falls and selling when the price rises.
Buy Signal
- When penetrating the center line from bottom to top
Sell Signal
- When penetrating the center line from top to bottom
Cryptocurrency Systre / Automatic Trading Tool
Sirius Trader (Spot・Futures)
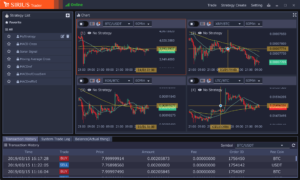
SIRIUS Trader is a cryptocurrency trading tool that allows you to create your own cryptocurrency trading strategy by selecting technical indicators and various conditions with the mouse operation. Users can easily start automatic trading of virtual currencies without the need for program knowledge or difficult operations.
AD.


Leave a Reply