
The PVI (Positive Trading Volume Index) tracks changes in the number of trades in a symbol and trading volume.
Oscillator that can determine the bullish or bearish market based on calculations based on price movements and volume.
Sirius Future’s Chart
① Check Bottom Price The stage where the bottom is confirmed and it is time to consider buying.
② Rebound This is a level that rebounded from the floor. It is usually desirable to buy at this level for a compliant investment.
③ Soaring It is rising. In this case, you should invest in order, paying attention to the fact that the volume is not extremely reduced.
④ Slow Down It’s time to think about closing hands (selling).
⑤ Check the Ceiling This is the stage where you want to check the ceiling.
⑥ Drop It is a scene where the ceiling was attached and it fell back. If you are a modest investor, you usually want to sell it here.
⑦ Continual Fall This is the phase where the market has completely entered the downtrend.
⑧ Bottom Kneading It is time to make a prediction that it will not fall any further at the bottom.
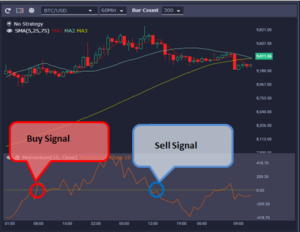
Buy Signal
Crossing the zero line.
Sell Signal
Crossing below the zero line.
Virtual currency system trading ・ automatic trading tool
Sirius Trader(Spot・Futures)
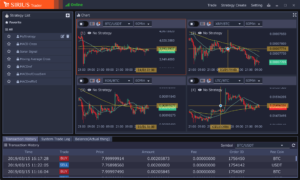
Create strategies within candlestick charts, compare the performance of multiple strategies through back testing, select the most effective and begin trading.
Download Now
AD.


Leave a Reply