
We judge overheating of the market (overbought and oversold) against the whole fluctuation range.
Relative Strength Index (RSI) is a trading method of so-called “contrarian” (buy when price goes down and sell when price goes up), so it is effective for range markets.
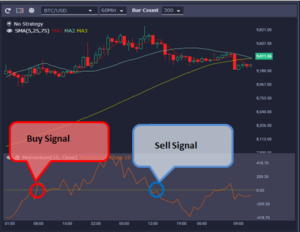
Sirius Future’s Chart
Relative Strength Index (RSI) is a conservative quote, selling up when it goes up and buying it down.
Buy Signal
・ When RSI, which has been below 30%, has risen above 30%
・ Busy divergence: When prices have fallen and renewed lows, but RSI has not fallen below lows
・ Failer Swings: Uptrend Rebounds immediately after RSI drops below 40%
Sell Signal
・ When RSI, which had been at 70% or more, has fallen below 70%
・ Bare Bearish: Price has risen and updated to a high price, but RSI has not exceeded the high price
・ Fairer Swings: A downtrend When it falls immediately after RSI rises to more than 60%
Virtual currency system trading ・ automatic trading tool
Sirius Trader(Spot・Futures)
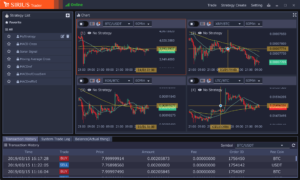
Create strategies within candlestick charts, compare the performance of multiple strategies through back testing, select the most effective and begin trading.
Download Now
AD.


Leave a Reply