
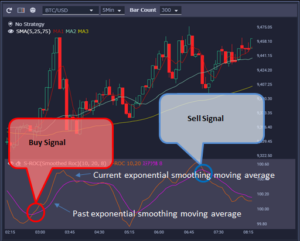
Stochastics uses the highs and lows over a period of time to determine market overheating, such as overbought. The current price will be compared with the high and low prices for a certain period to determine where it is.
RSI, which is similar to stochastics, is determined by buy zone and sell zone, whereas stochastics is a technical indicator that is relatively easy to judge because trading signals are clearly output using two lines. .
Sirius Future’s Chart
It displays two lines with different movements, “% K”, which is the base, and “% D”, which averages% K, and determines the timing of buying and selling based on the position and the intersection of the two lines.
Basically, when% K is 75% or more, the overbought level is the selling level, and when% K is 25% or less, the oversold level is the buying level.
Buy Signal
When “% K” exceeds “% D”
Sell Signal
When “% K” falls below “% D”
Virtual currency system trading ・ automatic trading tool
Sirius Trader(Spot・Futures)
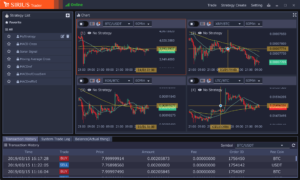
Create strategies within candlestick charts, compare the performance of multiple strategies through back testing, select the most effective and begin trading.
Download Now
AD.


Leave a Reply