
RVI is an abbreviation for Relative Volatility Index, which is a relative volatility index.
It is used to determine if market volatility is increasing or decreasing. RVI is also used in charts for stocks, exchanges and commodity futures.

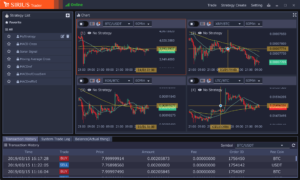
Sirius Futures Chart
The most commonly used RVI parameters are 10 and 14 days.
RVI judges the direction of volatility by observing the movement that usually changes between 1.0 and -1.0 with “0” as the standard. From the perspective of volatility, we will plan trading timing based on the 0 line.
The signal line is a smoothed RVI moving average with a 4-day (general) cycle, and the golden cross and dead cross can be applied to this signal line and RVI line. The golden cross is a buy signal and the dead cross is a sell signal.
Buy Signal
- When the RVI line breaks above 0
- When the RVI line breaks above the signal line
Sell Signal
- When the RVI line breaks below 0
- When the RVI line breaks below the signal line
Cryptocurrency Systre / Automatic Trading Tool
Sirius Trader (Spot・Futures)
SIRIUS Trader is a cryptocurrency trading tool that allows you to create your own cryptocurrency trading strategy by selecting technical indicators and various conditions with the mouse operation. Users can easily start automatic trading of virtual currencies without the need for program knowledge or difficult operations.
AD.


Leave a Reply