
Developed by Paul Dysart, it is an index that is calculated based on price movements and volume, and can be used to check market movements.
Sirius Future’s Chart
This oscillator will be used in conjunction with the 255-day EMA to make decisions.
Basically, it is a simple method of checking whether NVI is moving above or below the 255-day index moving average.
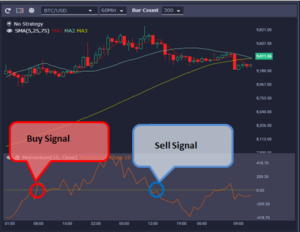
Buy Signal
When NVI crosses the exponential smoothing moving average line from bottom to top
Sell Signal
When NVI crosses the exponential smoothing moving average line from top to bottom
Virtual currency system trading ・ automatic trading tool
Sirius Trader(Spot・Futures)
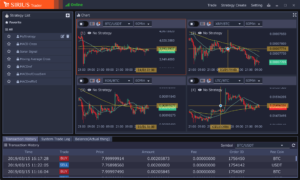
Create strategies within candlestick charts, compare the performance of multiple strategies through back testing, select the most effective and begin trading.
Download Now
AD.


Leave a Reply